Creating actionable analytics for Amazon sellers

Amazon sellers drown in data. Sales rankings shift hourly. Keyword positions fluctuate daily. Competitor movements happen constantly. The information exists, but making sense of it—turning raw numbers into actionable decisions—requires tools that clarify rather than overwhelm.
Datarova built a SaaS platform to solve this problem, providing Amazon sellers with performance tracking, keyword optimization, and account management capabilities. The features were comprehensive. The data was accurate. But the interface hadn't kept pace with the platform's sophistication.
Complex features felt complicated to use. Performance metrics required too many clicks to filter and analyze. Team management and billing workflows created friction. The design wasn't showcasing the platform's intelligence—it was hiding it behind cluttered interfaces and unclear navigation.
Datarova needed an MVP redesign that could handle their robust feature set while making the experience feel effortless. They needed to transform data complexity into visual clarity.

Understanding seller workflows and pain points
Amazon sellers operate in a high-stakes, fast-moving environment. They're monitoring dozens or hundreds of products simultaneously, tracking rankings across multiple categories, optimizing keywords based on search trends, and making pricing decisions that directly impact profitability.
Their relationship with analytics tools is utilitarian. They need answers fast. Which products are trending up? Which keywords are losing position? Where should attention and budget go today?
Through user research and workflow analysis, several patterns emerged:
Speed determines tool adoption. Sellers won't wait for slow interfaces or multi-step processes to access critical data. If getting an answer takes too long, they abandon the tool and make decisions based on instinct instead of data.
Filters and customization are essential. No two sellers analyze data identically. Some focus on specific product categories. Others track competitor movements. Many need to segment by date ranges, marketplaces, or custom tags. Generic views don't serve anyone well.
Visual clarity beats numerical precision. Sellers need to spot trends and anomalies quickly. A color-coded ranking table reveals patterns instantly. Rows of numbers require mental processing. When monitoring hundreds of data points, visual encoding is the difference between insight and information overload.
Billing surprises kill trust. Usage limits, overage charges, and failed payments need to be transparent and manageable. Unexpected service interruptions or surprise bills create support tickets and churn.
These insights shaped our entire design strategy. Every interface decision was evaluated against one question: does this help sellers make faster, better decisions?
Designing for data visibility and control
The core platform features needed complete redesigns focused on clarity and efficiency.
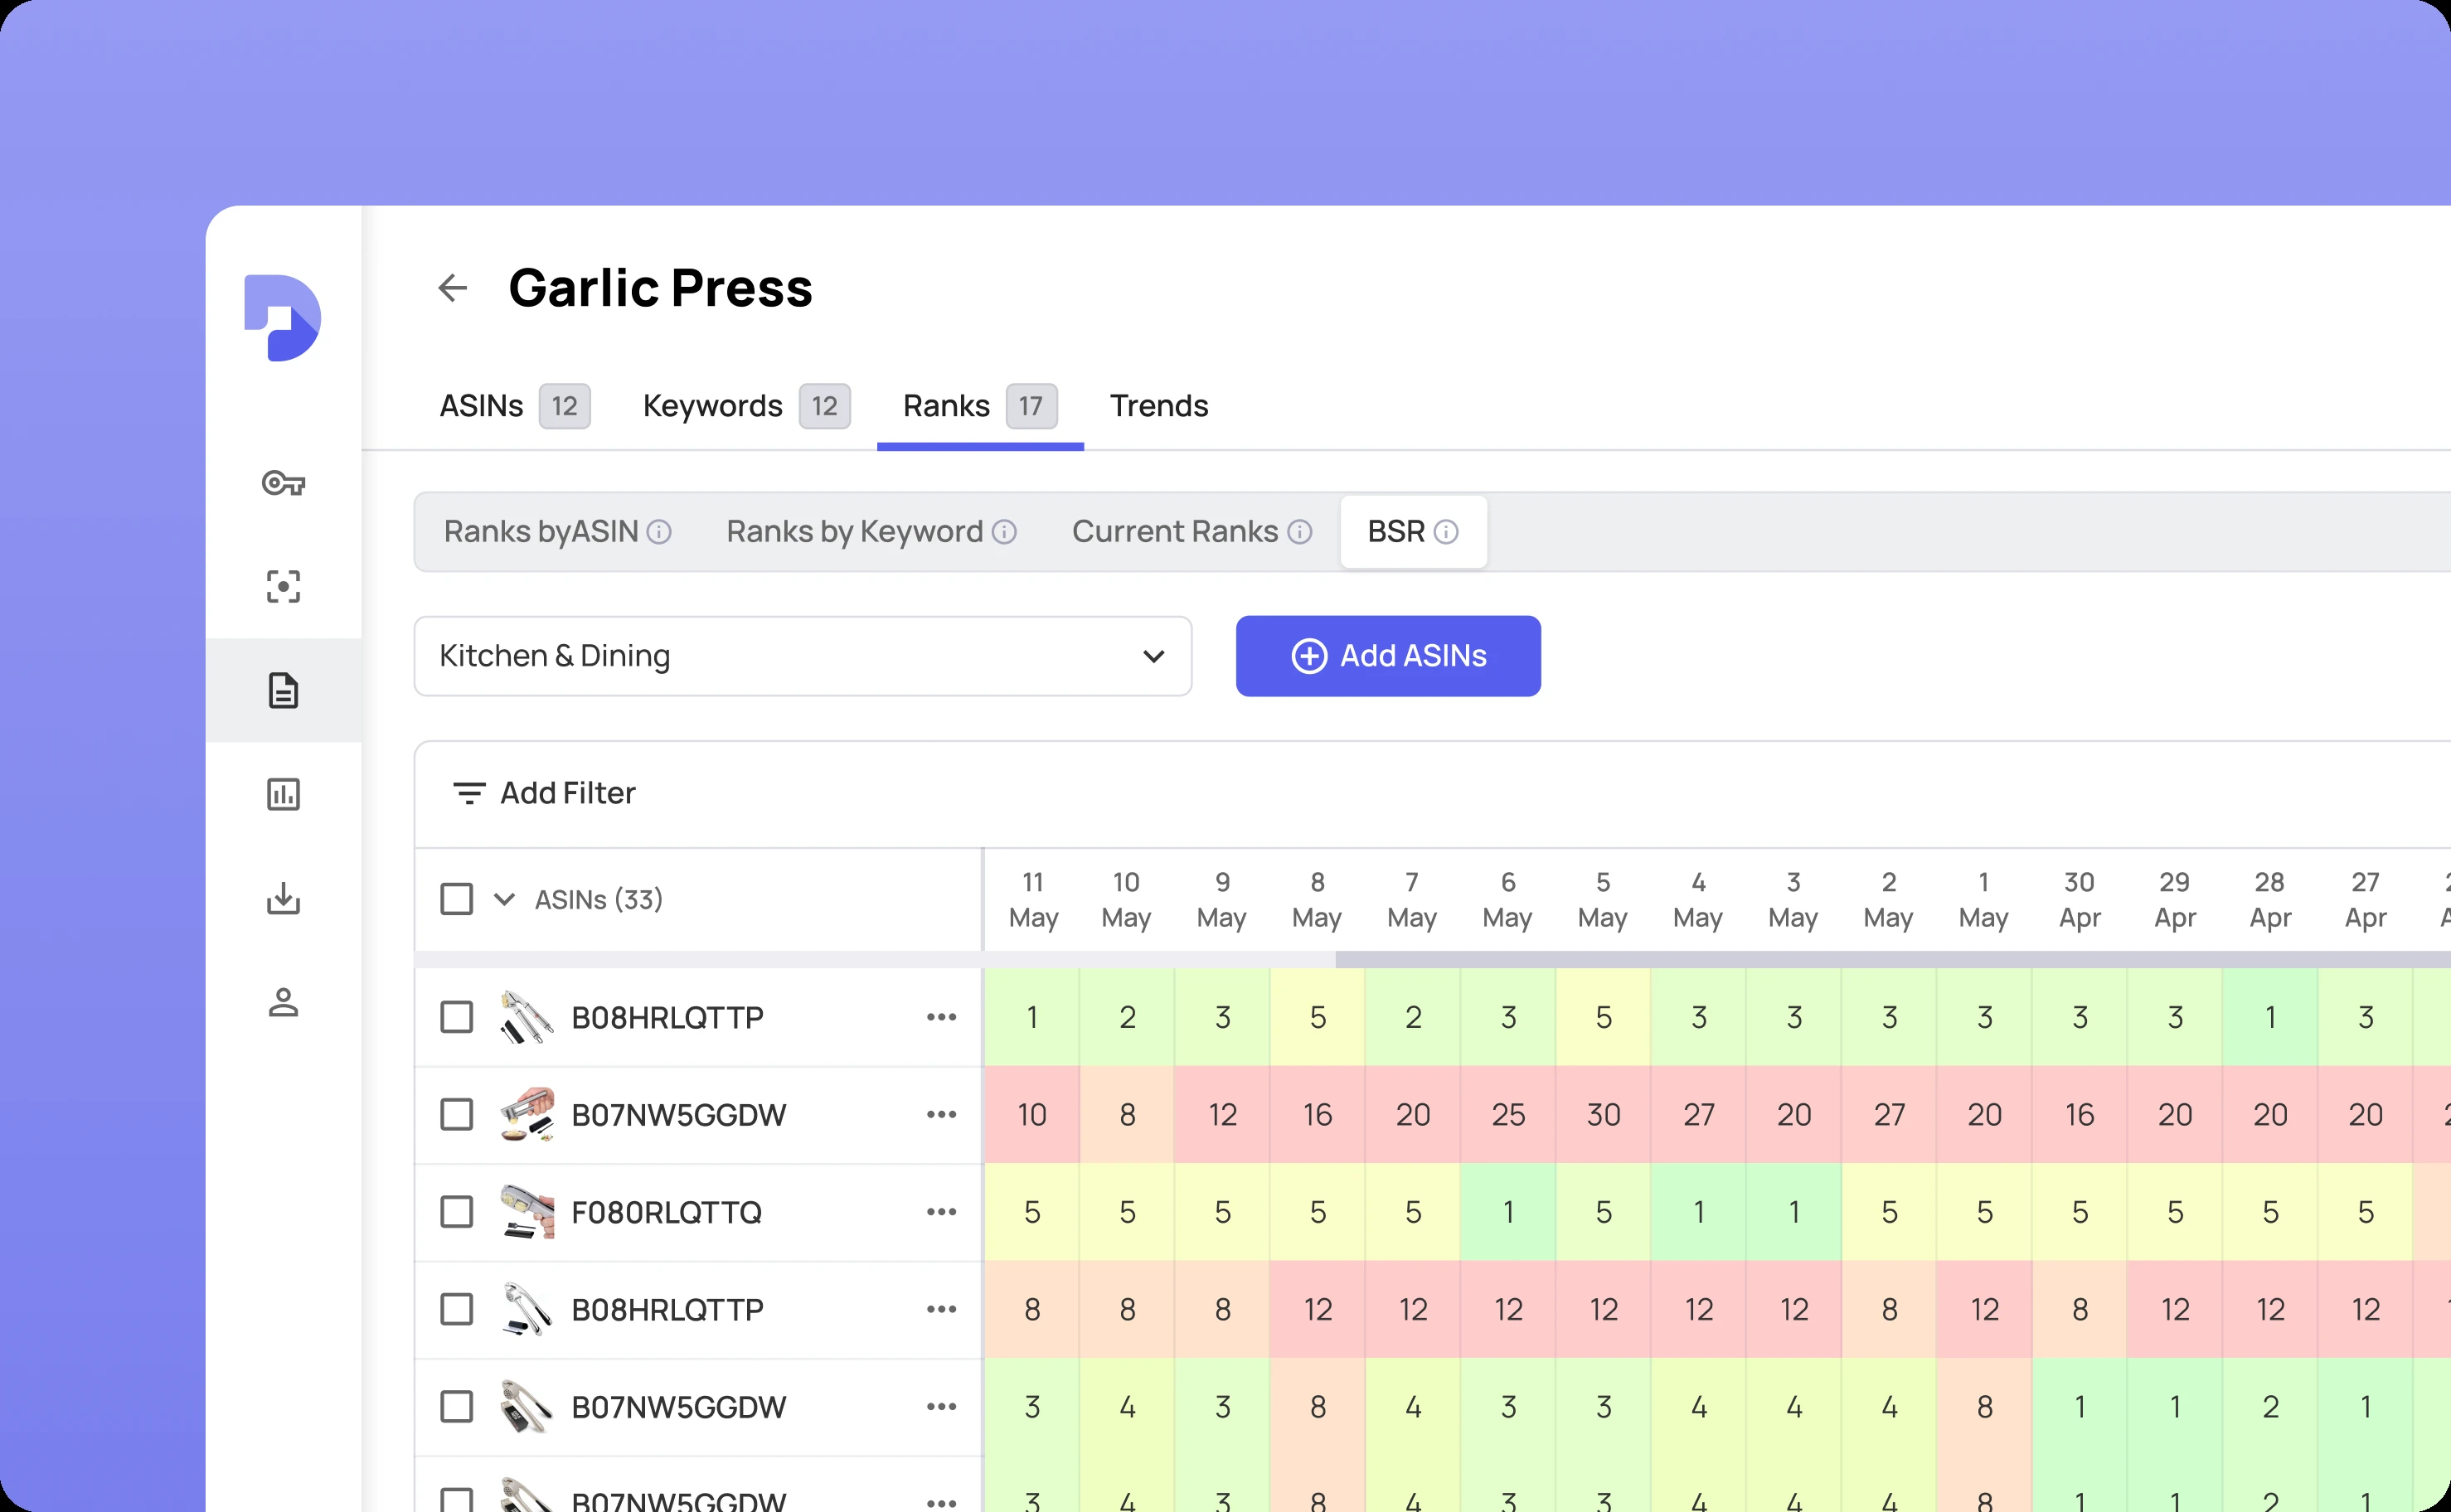
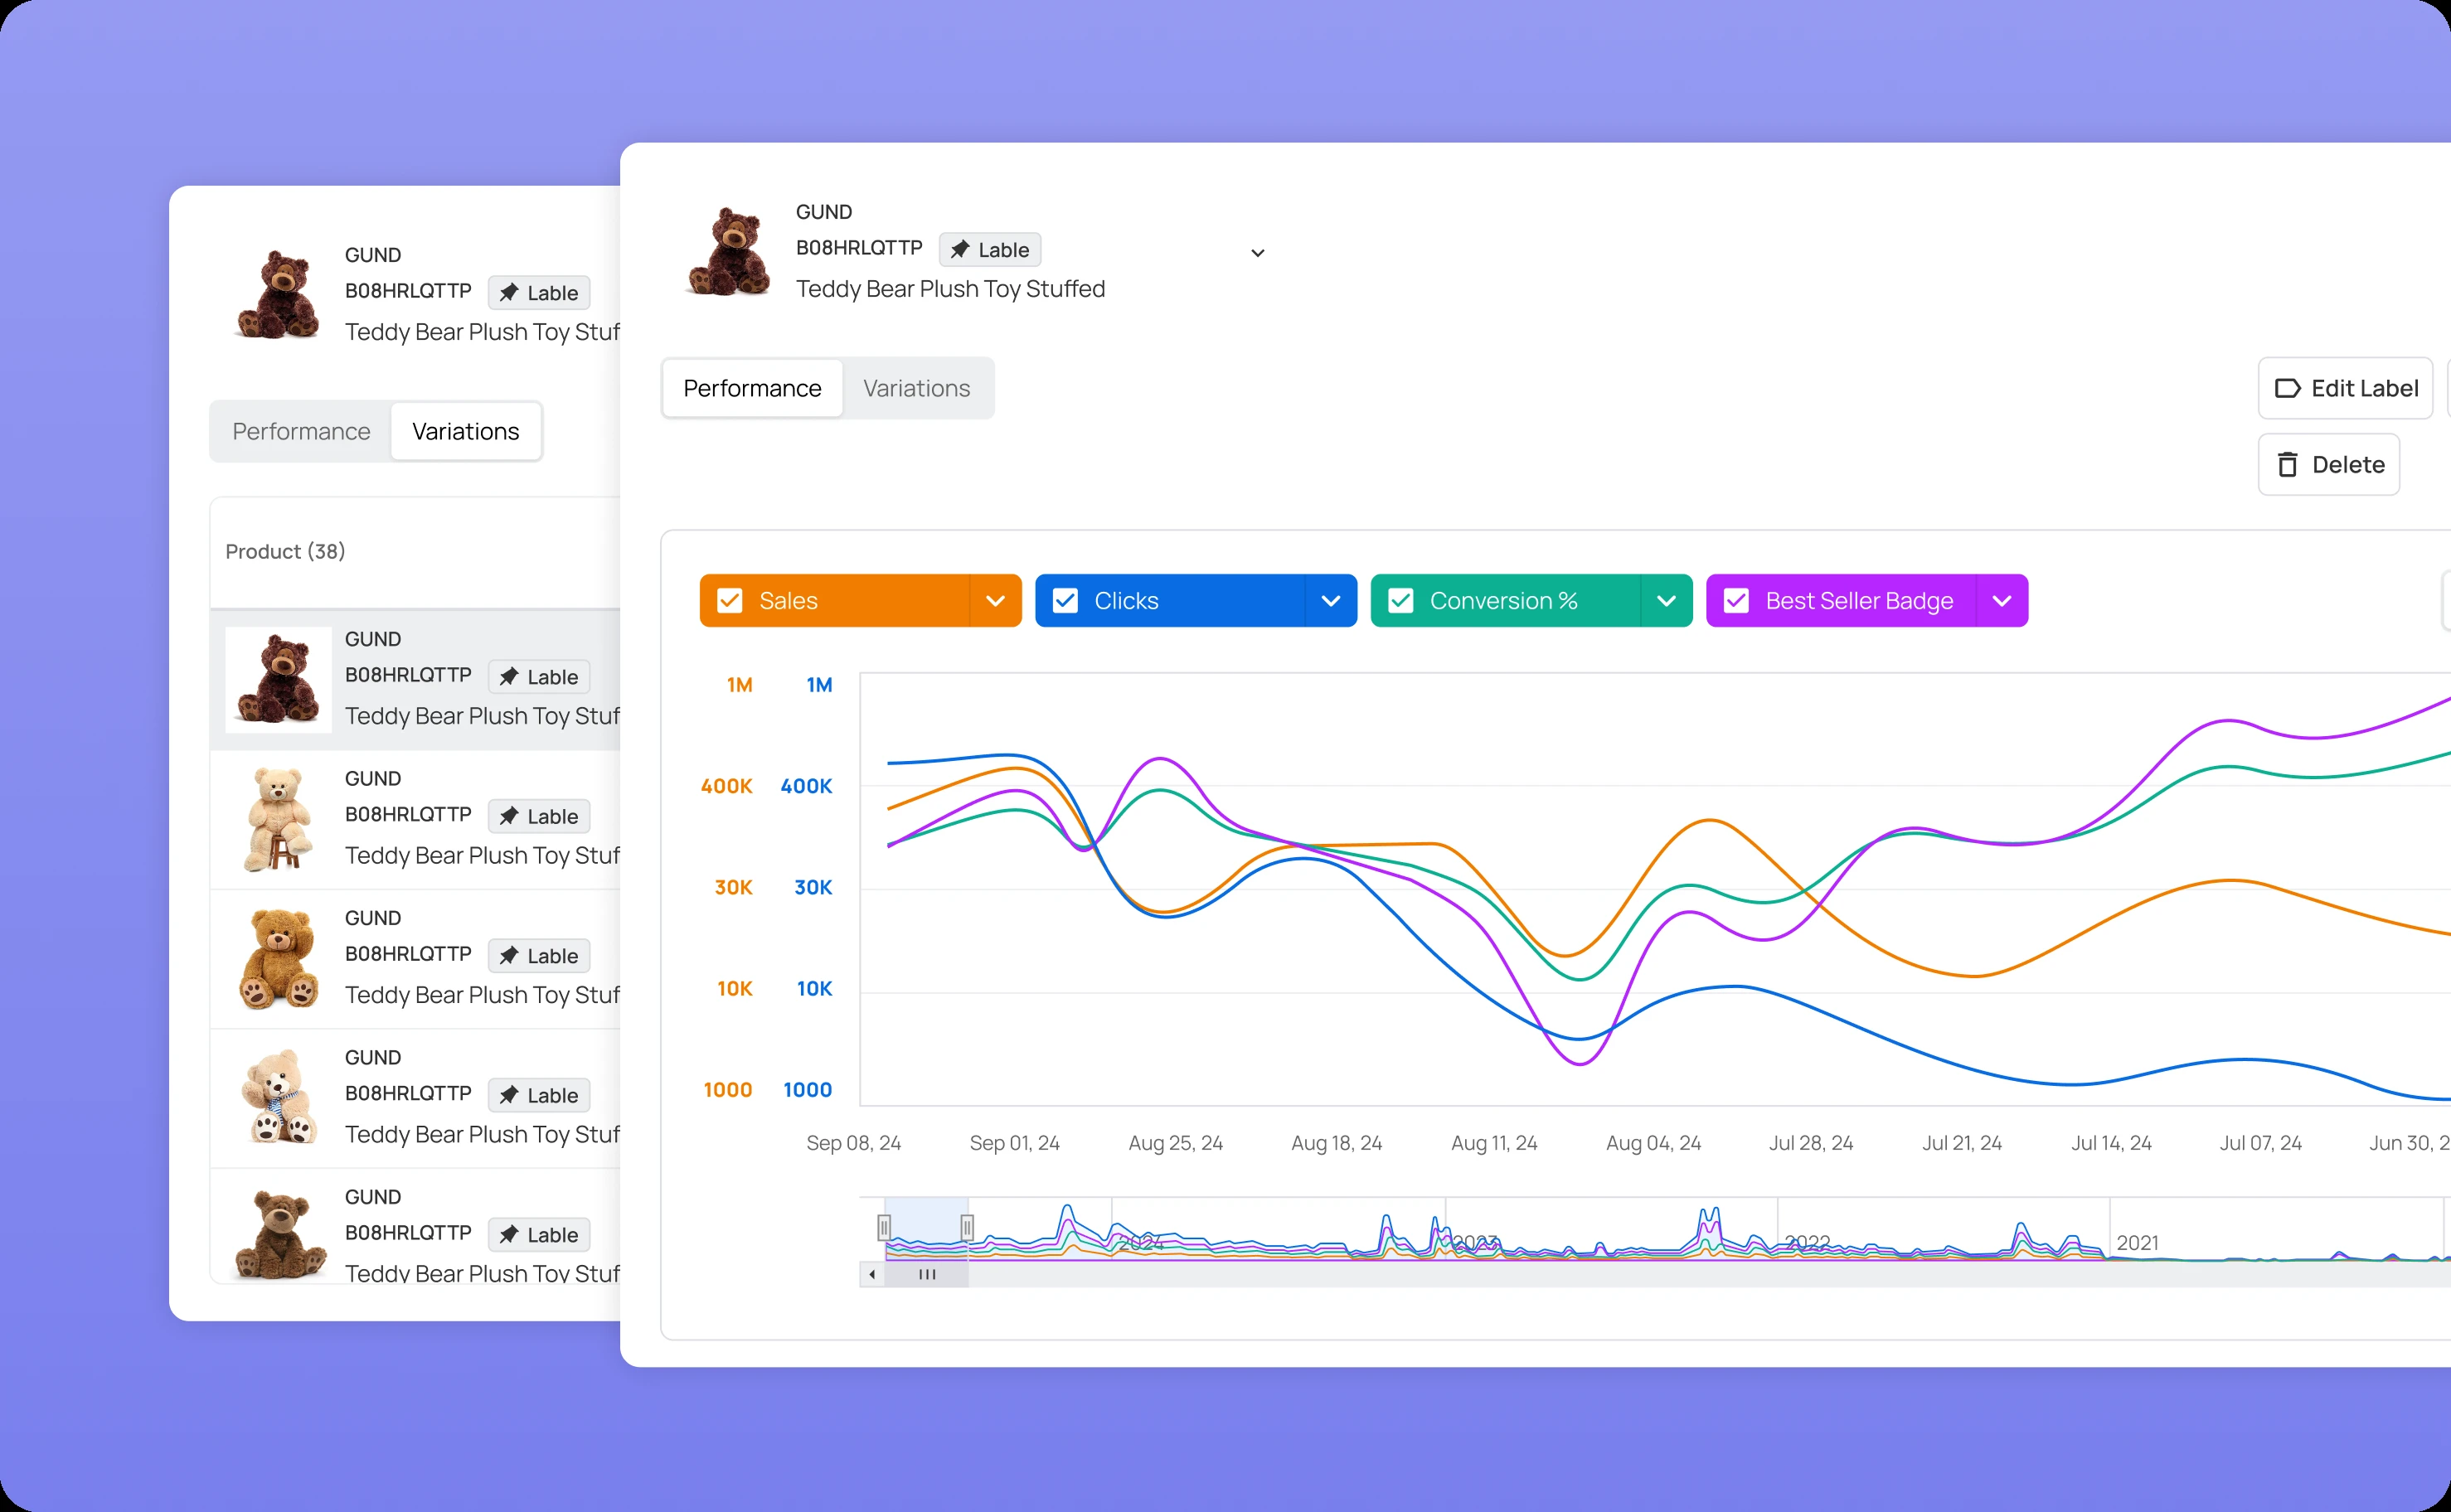
Best Seller Rank (BSR) tracker
Seller rank tracking is fundamental to Amazon success, but the original interface made pattern recognition difficult.
We redesigned the BSR tracker around color-coded visualization. Rankings improving over time display in green. Declining rankings show in red. Stable positions remain neutral. Users can scan hundreds of products and immediately identify what needs attention.
The table supports flexible filtering by product category, marketplace, date range, or custom tags. Export options let sellers pull data into spreadsheets for deeper analysis or reporting. The ability to add notes directly to data points creates context for future reference—"competitor launched price promotion" or "changed main product image"—connecting ranking changes to specific actions.
This isn't just prettier data presentation. It's fundamentally different information architecture that prioritizes pattern recognition over raw number display.
Keywords overview
Keyword optimization requires tracking multiple metrics simultaneously: visibility scores, average positions, ranking distribution, search volume trends, and competitive density.
The redesigned keywords overview consolidates these dimensions into a unified interface. Metrics display alongside each keyword with visual indicators highlighting significant changes. Distribution trends show graphically, revealing whether keywords are gaining or losing ground across product listings.
Filtering and customization options let users focus on high-priority segments—tracking top-performing keywords separately from experimental ones, isolating underperforming terms that need optimization, or monitoring competitor keyword movements.
The interface supports quick action. See a keyword losing position? Click through to the optimization workflow. Notice a competitor gaining ground? Export the data for strategic analysis. The design eliminates barriers between insight and action.
Saved filters
Repetitive tasks are productivity killers. Sellers who check the same data segments daily—"my top 20 products in the home goods category" or "keywords ranking positions 11-20"—shouldn't recreate filters every time.
We designed a saved filters system that stores commonly used configurations. Create the filter once, name it clearly, and access it with a single click thereafter. This transforms multi-step processes into instant recalls.
Saved filters work across features—BSR tracking, keyword analysis, team management views—creating consistent efficiency throughout the platform. Power users can build personal dashboards from saved filters, curating exactly the data views they need most frequently.
Streamlining subscription and team management
Supporting features matter as much as core analytics. Clunky billing or team management undermines the entire experience.
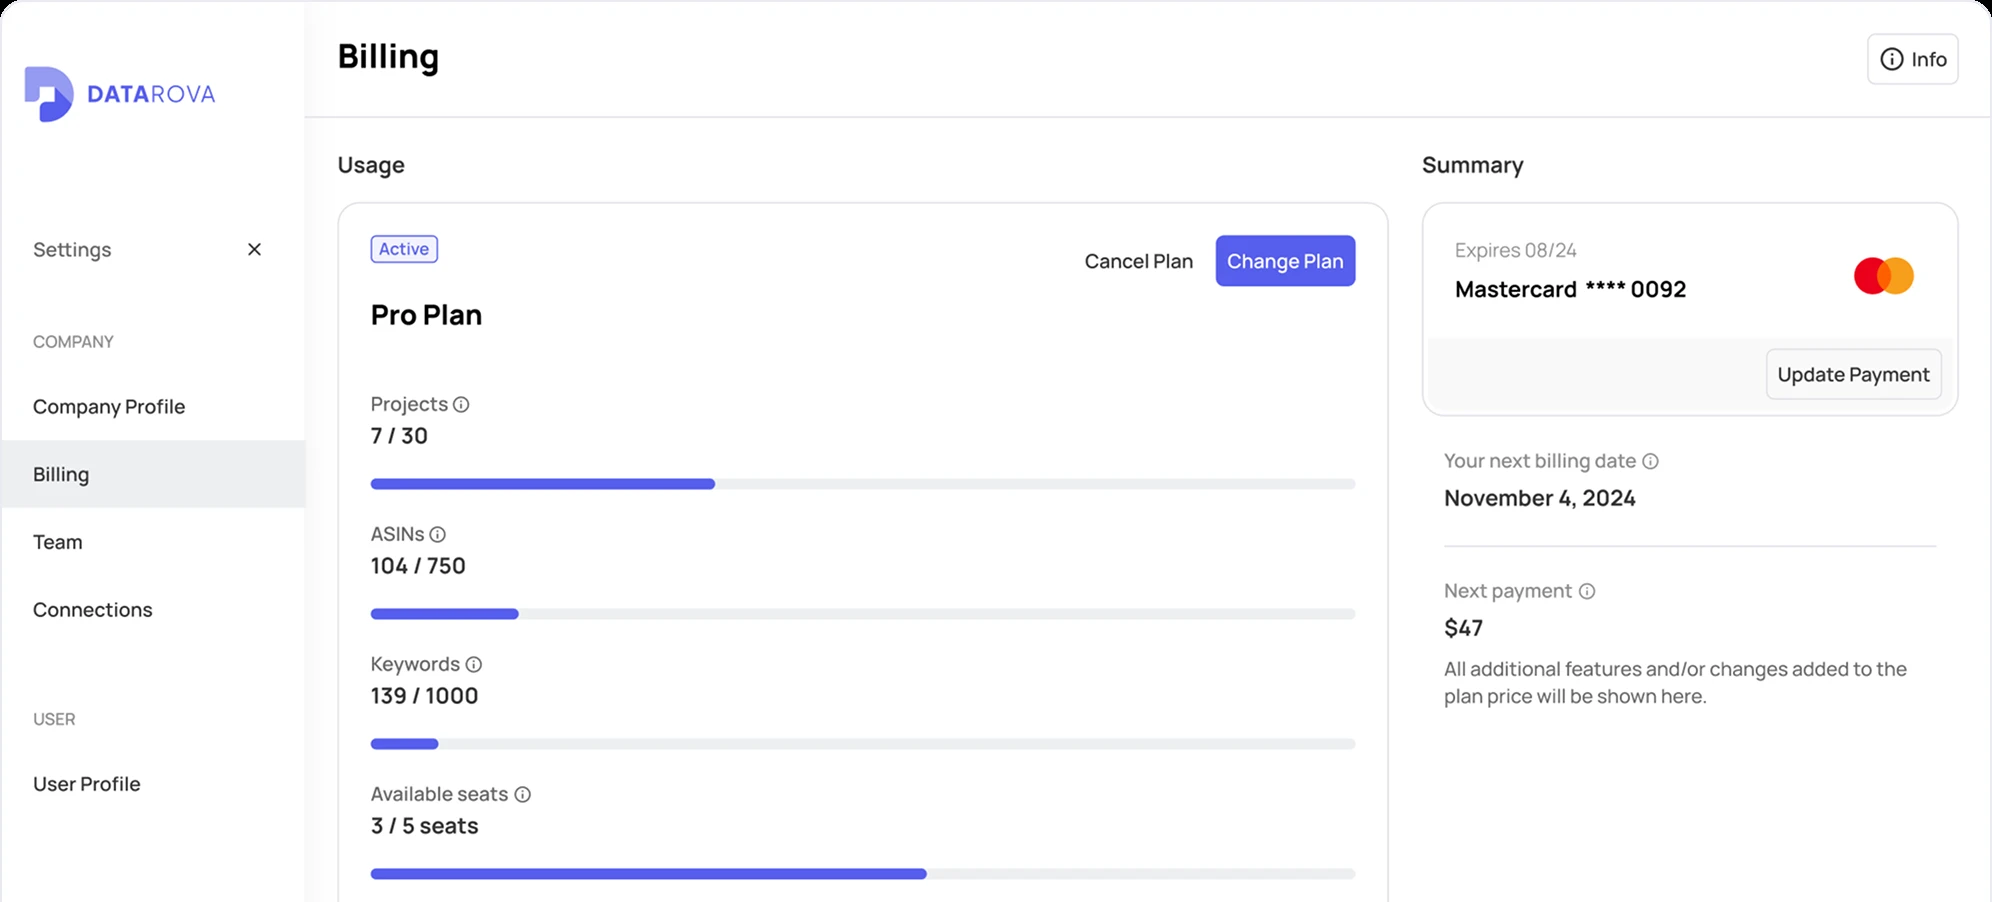
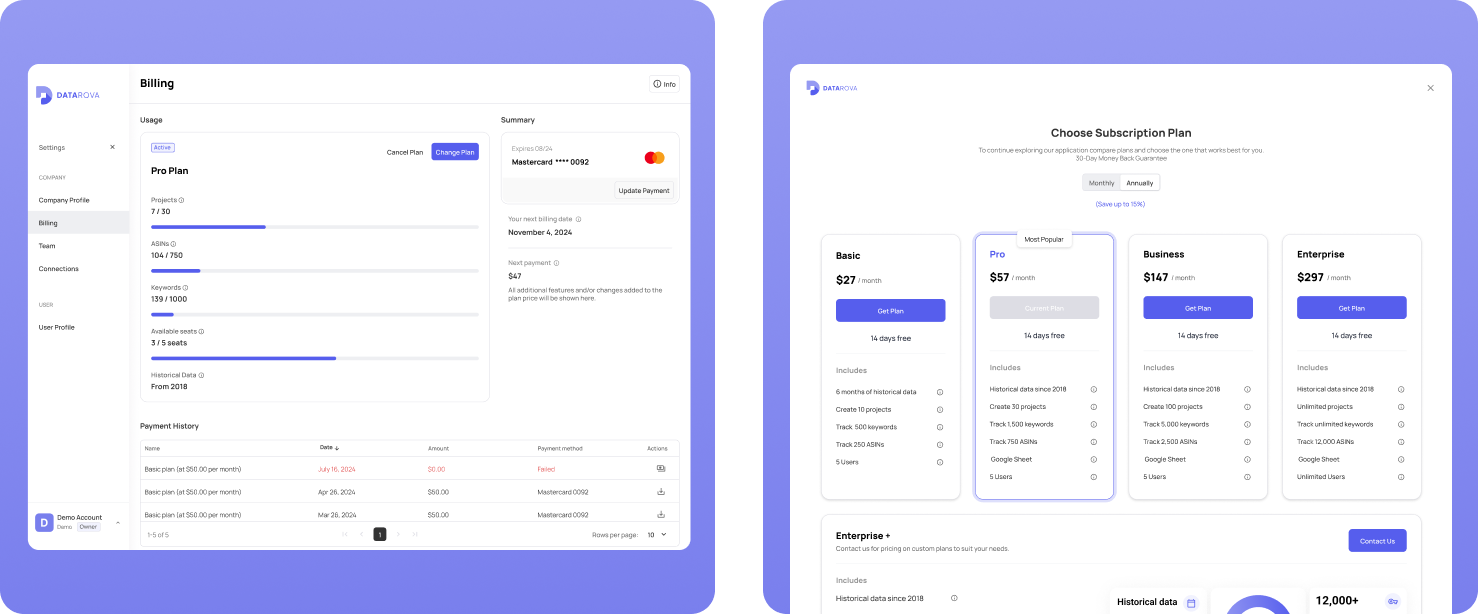
Billing page redesign
We rebuilt subscription management around transparency and proactive communication.
Progress bars show current usage against plan limits for projects, ASINs tracked, and keywords monitored. Users can see at a glance whether they're approaching capacity. Proactive notifications appear before limits are reached, encouraging timely upgrades rather than surprising users with service interruptions.
Payment history displays clearly with downloadable invoices. Plan comparison tools help users understand upgrade options without leaving the billing interface. Failed payment retry flows guide users through resolution without creating support tickets.
The design eliminates billing anxiety through visibility and control. Users always know where they stand and can manage their subscription confidently.
Team management tools
Agencies and larger sellers need multi-user access with permission controls. The team management interface lets account owners invite members, assign them to specific projects, and restrict access to sensitive data or billing controls.
Role-based permissions are clear and granular. Users understand exactly what access they're granting. The interface supports common scenarios—adding a virtual assistant with limited permissions, giving an agency partner full project access, or creating read-only analyst accounts.
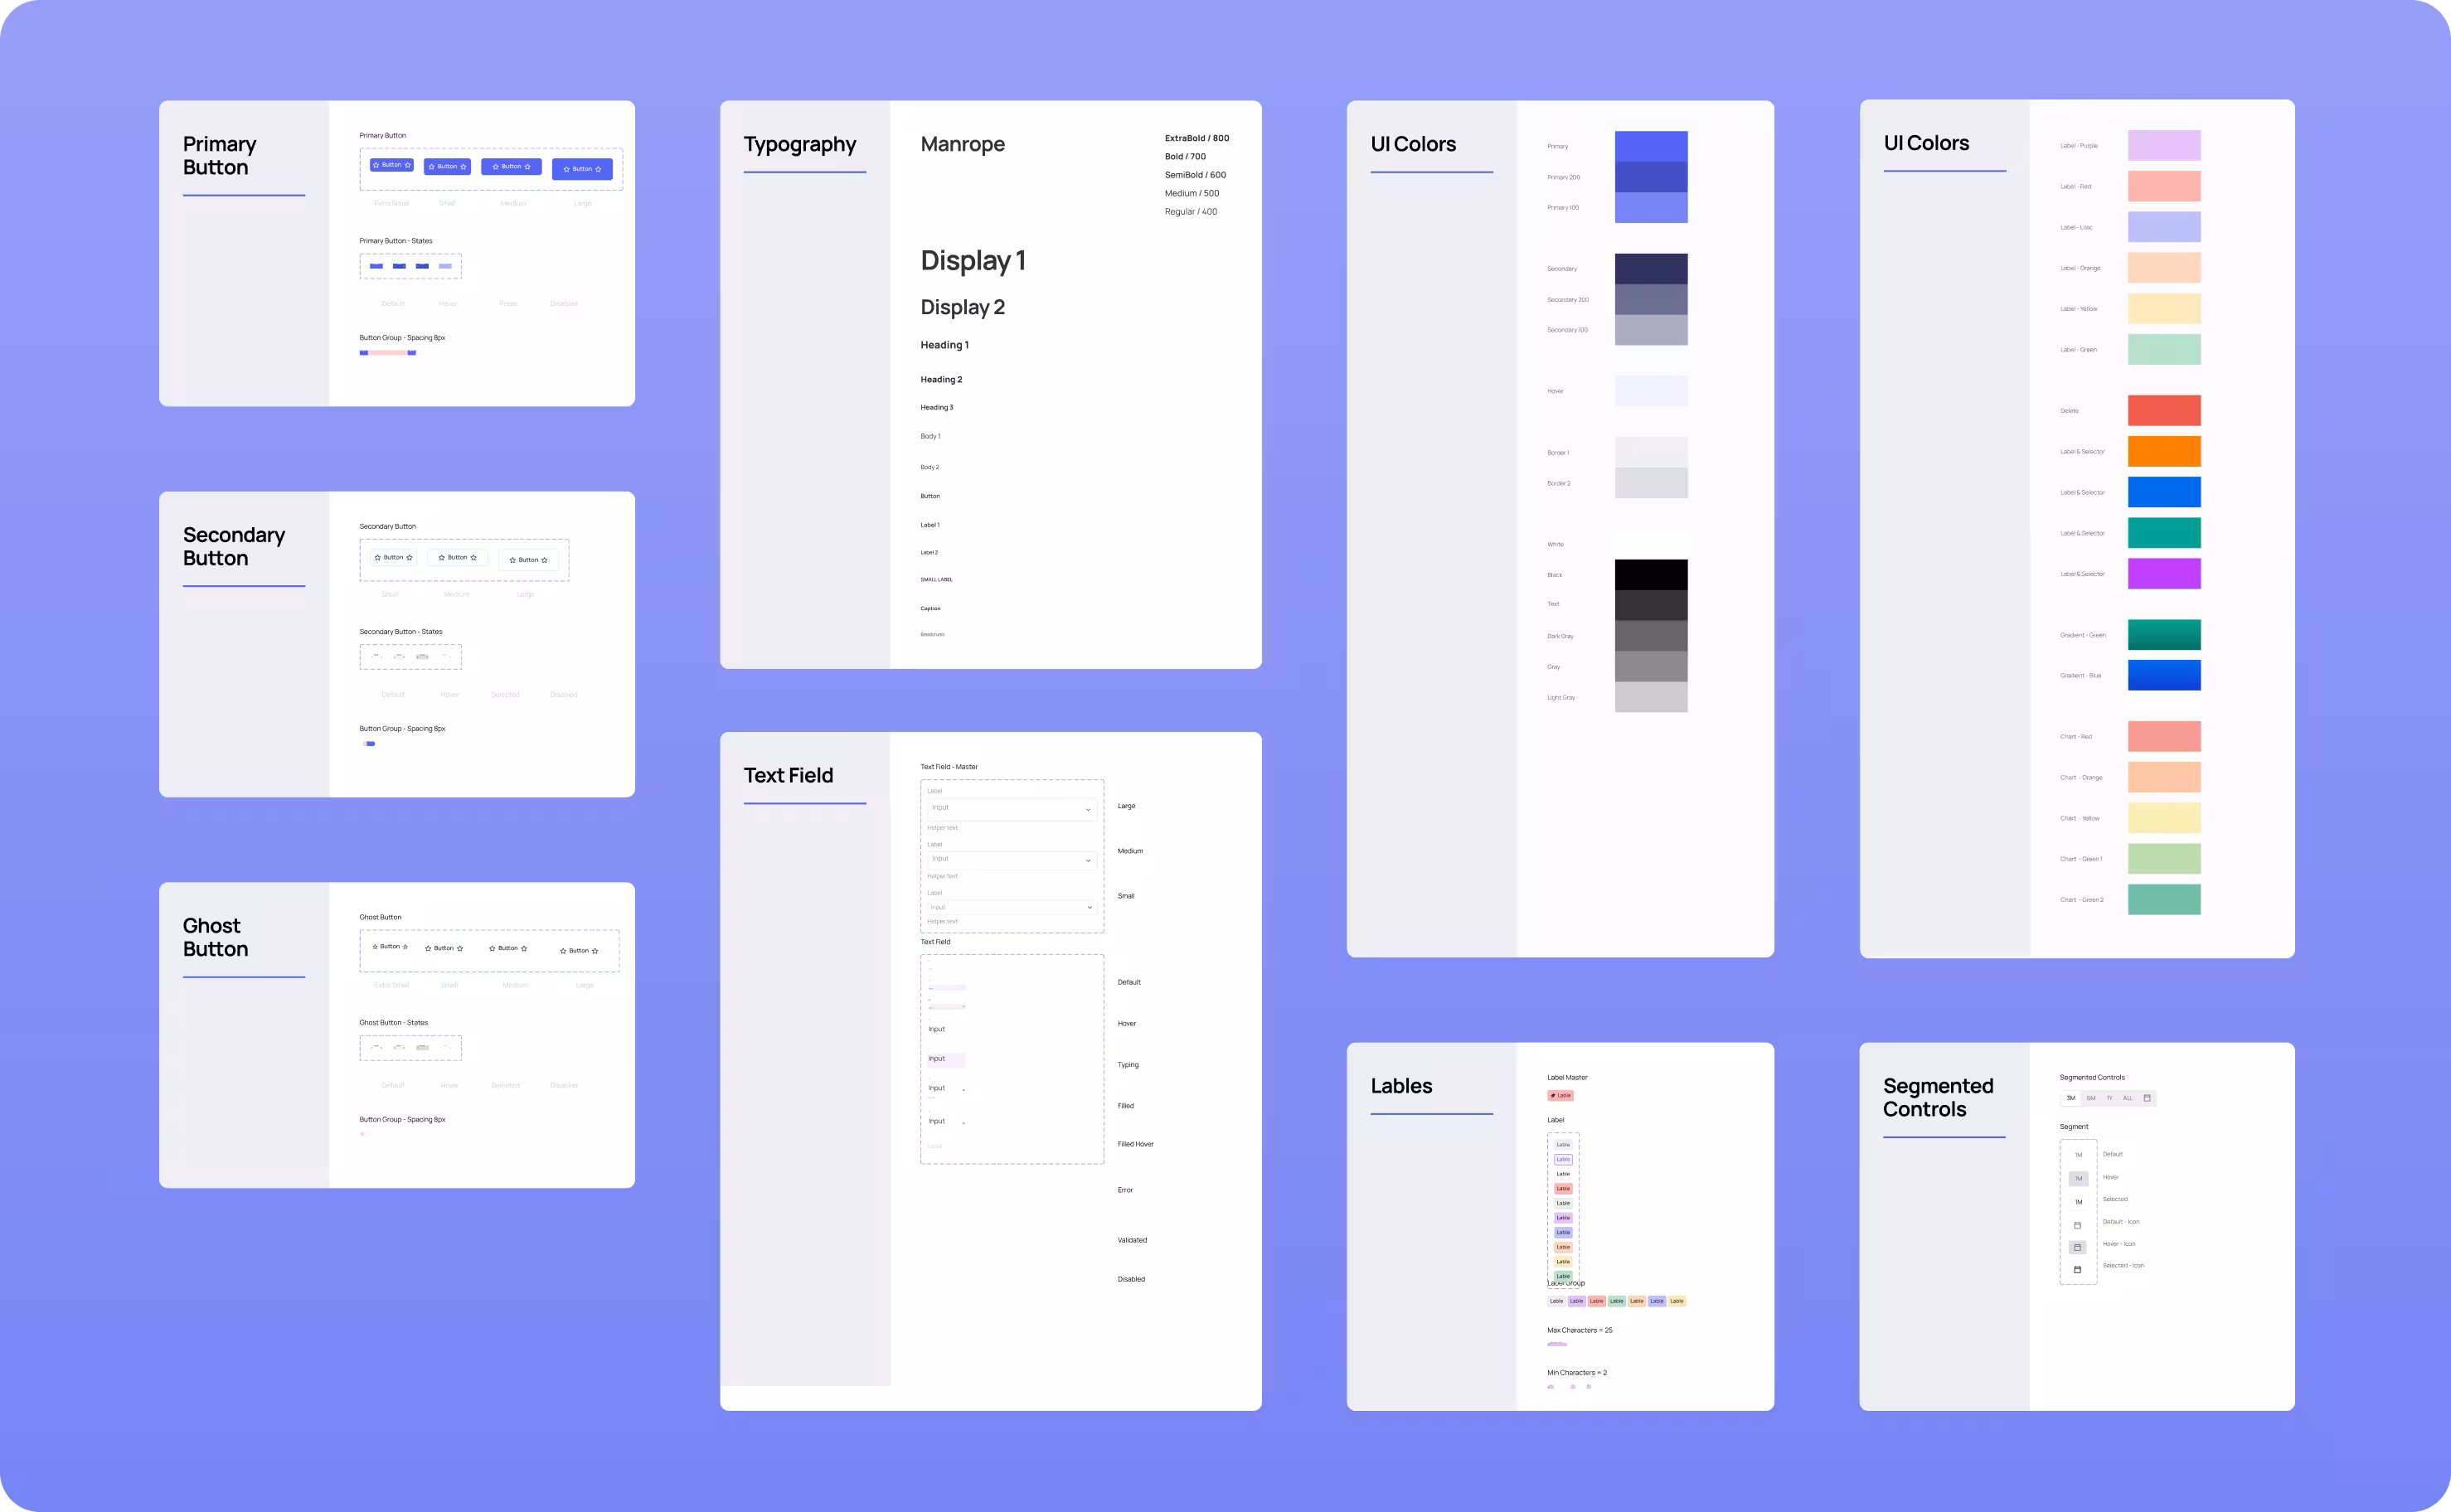
Rebuilding the design system foundation
Throughout the redesign, we completely restructured Datarova's design system from scratch.
The original component library had accumulated inconsistencies as features were added over time. Components lacked proper auto layout. Typography styles weren't systematically defined. Colors existed without documented usage rules.
We cleaned up and reorganized every component, implementing proper auto layout for responsive behavior. Typography and color systems were refined and documented. Every component was verified against the production environment to ensure design specifications matched implementation reality.
This foundational work wasn't just about visual consistency. It was about sustainable development velocity. With a proper design system, new features can be built faster using established patterns. Visual quality stays consistent without manual checking. The platform can scale without accumulating design debt.
Ensuring implementation quality through design QA
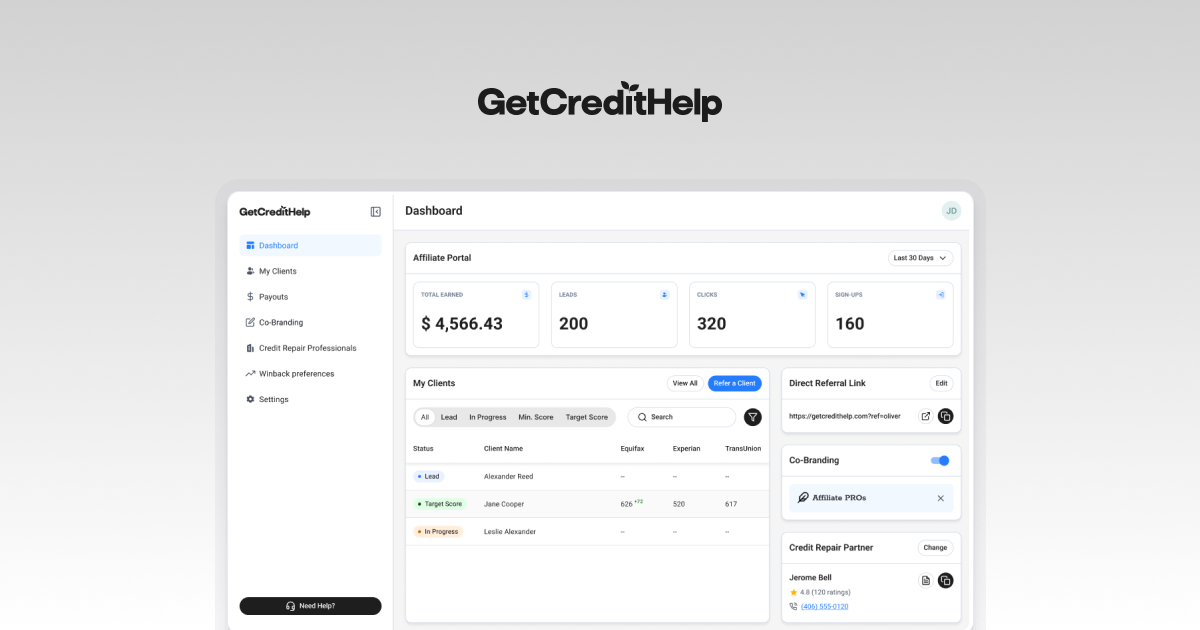
Marketplace participants need dashboards that surface the right information at the right time.
Client dashboard
Designing great interfaces means nothing if implementation falls short.
We invested heavily in Design QA, rigorously reviewing development implementation against design specifications. This caught issues early—spacing inconsistencies, incorrect color values, missing interaction states, broken responsive behaviors.
Critical features like saved filters, dropdown trees, and billing workflows received particularly thorough QA attention. These are complex features where implementation details matter enormously. A dropdown tree that doesn't maintain selection state is frustrating. A billing page with misaligned spacing feels unpolished.
The iterative feedback between design and development ensured the final product matched the intended experience. Polish isn't about perfection—it's about attention to detail in the places users actually notice.
What it accomplished
The redesigned Datarova platform transformed how Amazon sellers interact with their analytics.
Data analysis became faster. Visual clarity replaced numerical clutter. Saved filters eliminated repetitive work. Billing transparency reduced support tickets. Team management enabled collaboration without compromising security.
Sellers can now extract insights quickly and act on them confidently. The interface showcases Datarova's analytical sophistication instead of hiding it behind complexity.
The MVP established a scalable foundation. As Datarova adds features and grows its user base, the design system and interaction patterns support expansion without requiring constant redesign.
Related case studies